
Abstract
The current study investigated effects of stress upon mental health mediated by copying style. A sample of n=176 (males=115; females=61) lecturers working at college level from southern districts of Punjab was taken and surveyed. Self-structured questionnaires consisted occupational stress, mental health, and copying style. Frequency and parentage were used assess the individuals' demographic characteristics; however, correlation, regression, mediation, and significance testing were also done. Results indicated that teacher stress has statistically significant relationship with coping strategies (r=.442**, p < 0.01). Likewise, the table indicated a statistically significant linear relationship between teachers’ stress and mental health (r=.721**, p < 0.01). Regression analysis indicated that occupational stress and coping strategy statistically predicted mental health of the colleges’ teachers (p < 0.05). Additionally, an increase in the coefficient value of the mediation analysis from (.265 to.712) showed that the mediating variable fully mediated the association between occupational stress and mental health.
Key Words
Occupational Stress, Mental Health, Physical Education Teachers, Punjab
Introduction
Justification
The condition in any workplace leads to occupational stress. These conditions negatively affect ones’ physical and mental health. In addition to that, abilities and performance of the employees can be influenced by stressful working atmosphere. It has a major impact on their quality of life, health, job satisfaction, absenteeism, and employee turnover (Almatrooshi, Singh& Farouk, 2016). Teachers are thought to have a higher rate of general mental health issues like anxiety, depression, somatization disorders, and burnout than persons in other occupations
(Van Droogenbroeck & Spruyt, 2015).
According to the World Health Organization, mental health is a state of well-being in which a person can identify their own potential, manage common life challenges, work productively and fruitfully, and give back to their community (Kang et al., 2020). The WHO also believes that mental health issues are caused by a complex combination of psychological, biological, environmental, and social variables. Mental illness is the most frequent kind of sickness among employees and is a substantial worldwide health issue (Kang et al., 2020). Employees with poor mental health may perform poorly, resulting in job loss and financial suffering (Andreeva et al., 2017).
According to research, the workplace environment has a significant impact on the occurrence of mental health issues among employees. Occupational stress and mental health have a substantial association (Barnay, 2016). Poor mental health can harm physical health, and mental health issues are more common in certain vocations due to the significant psychosocial nature of the work (Kang et al., 2020).
Teachers employ a range of coping mechanisms because stress has such a detrimental effect on one's health. As a result, coping is defined as a collection of deliberate actions and thought processes used to handle a stressful situation or event in order to minimise the negative effects (Agbonluae, Omi-Ujuanbi&Akpede, 2017). Coping requires a thorough cognitive evaluation of a person's belief in his or her ability to handle a challenging situation. Active and passive or approach and avoidance stress coping strategies are other names for emotion-focused coping, which focuses on reducing negative emotional reactions, and problem-focused coping, which focuses on finding workable solutions to stressful situations.
Objectives
1. To examine the relationship between the independent variable (occupational stress) and mediator (coping style) with dependent variable (mental health) of colleges’ physical education teachers. (Correlation Analysis)
2. To find out the predictability of independent variable (occupational stress) with dependent variable (mental health) and mediator (coping style) of colleges’ physical education teachers. (Correlation Analysis)
3. To analyze the role of mediator (coping style) in the relationship between predictor (occupational stress) and criterion (mental health)of colleges’ physical education teachers. (Mediation analysis)
Hypotheses
H1 There is a positive and significant relationship between the independent variable (occupational stress) and mediator (coping style) with dependent variable (mental health) of colleges’ physical education teachers. (Correlation Analysis)
H2The predictor (occupational stress) and mediator (coping style) have significant effects on dependent variable (mental health) of colleges’ physical education teachers.
H3The relationship between occupational stress and mental health is mediated by coping style. (Mediation Analysis)
Materials and Method
Research Philosophy
Two important problems are addressed by research philosophy: 1) What is knowledge, and 2) how can knowledge be documented and passed on? The positivist philosophy considers knowledge that may be objectively verified by observation. The researcher proposed positivist philosophy in light of these thoughts on research philosophy.
Research Approach
The current study was focused on the perceived stance of Physical Education Teachers (PETs); hence, a cross-section survey approach was employed to recruit participants using questionnaires. For such sociological studies, a survey is indicated as an ideal tool.
Population and Sample
Physical education teachers at the college level in southern Districts of Punjab constituted the study's population. The information used in the formula originated from a pilot study that was carried out as part of the project planning stage to assess the questionnaire and gather some statistics for the formula to take into account when calculating sample size. The whole formula and the results of the computation are displayed in Table 3. The sample size was (n=176).
Table 1
| =((SD*SD)/(((E*E)/(Z*Z))+((SD*SD)/N))) | > SD width="19%" nowrap="">Z width="19%" nowrap="">E width="19%" nowrap="">N width="21%" nowrap="">n | > 0.43 width="19%" nowrap="">1.96 width="19%" nowrap="">0.043 width="19%" nowrap="">324 width="21%" nowrap="">175.76 | ||||
Tools for Data Collection
Different standardized scales/questionnaires were used to collect primary data. Self-reported questionnaires evaluating occupational stress, mental health, and coping style were given to participants to record their responses accordingly. The researcher utilized 'Factor-analysis' to obtain evidence regarding the validity of data in accordance with common survey data validity criteria.
Validity Statistics
Table 2
| KMO and Bartlett's Test | > Kaiser-Meyer-Olkin Measure of Sampling Adequacy. width="18%">.784 | > Bartlett's Test of Sphericity width="39%" valign="top">Approx. Chi-Square width="18%">1433.324 | > Df width="18%">105 | > Sig. width="18%">.000 | |||
Table 3
| Communalities | > width="8%"> Initial width="11%">Extraction | > To maintain discipline and order in the classroom. width="8%">1.000 width="11%">.814 | > To work with unmotivated students. width="8%">1.000 width="11%">.920 | > To work with agitated or unruly children. width="8%">1.000 width="11%">.608 | > Carrying out school duties during the time dedicated to my family (e.g. to read and mark offhand papers at home). width="8%">1.000 width="11%">.572 | > To teach in noisy condition (e.g. too much noise outside the street). width="8%">1.000 width="11%">.918 | > To teach in unsuitable thermal conditions (e.g. too cold). width="8%">1.000 width="11%">.790 | > To supervise students during breaks. width="8%">1.000 width="11%">.387 | > To work with papers or documents related to administrative activities. width="8%">1.000 width="11%">.861 | > To make trips with students. width="8%">1.000 width="11%">.553 | > To prepare students for competitions outside of school hours. width="8%">1.000 width="11%">.714 | > To prepare students for completion taking place during school hours. width="8%">1.000 width="11%">.537 | > To have to reckon with my colleagues. width="8%">1.000 width="11%">.611 | > To have inspection of evaluating situation in the classroom. width="8%">1.000 width="11%">.661 | > To help a child with poor academic results to progress. width="8%">1.000 width="11%">.878 | > To permanently pursue progress in students acquisitions. width="8%">1.000 width="11%">.497 | > Extraction Method: Principal Component Analysis. | ||||
Table 4
| Total Variance Explained | > Component width="232" colspan="3" valign="bottom">Initial Eigenvalues width="234" colspan="3" valign="bottom">Extraction Sums of Squared Loadings | > Total width="91">% of Variance width="89">Cumulative % width="54">Total width="93">% of Variance width="87">Cumulative % | > 1 width="52">4.048 width="91">26.985 width="89">26.985 width="54">4.048 width="93">26.985 width="87">26.985 | > 2 width="52">2.603 width="91">17.352 width="89">44.337 width="54">2.603 width="93">17.352 width="87">44.337 | > 3 width="52">1.343 width="91">8.951 width="89">53.288 width="54">1.343 width="93">8.951 width="87">53.288 | > 4 width="52">1.263 width="91">8.421 width="89">61.709 width="54">1.263 width="93">8.421 width="87">61.709 | > 5 width="52">1.066 width="91">7.109 width="89">68.819 width="54">1.066 width="93">7.109 width="87">68.819 | > 6 width="52">.958 width="91">6.390 width="89">75.209 width="54">width="93"> width="87">
| > 7 width="52">.851 width="91">5.670 width="89">80.879 width="54">width="93"> width="87">
| > 8 width="52">.790 width="91">5.264 width="89">86.143 width="54">width="93"> width="87">
| > 9 width="52">.630 width="91">4.197 width="89">90.340 width="54">width="93"> width="87">
| > 10 width="52">.500 width="91">3.331 width="89">93.671 width="54">width="93"> width="87">
| > 11 width="52">.417 width="91">2.782 width="89">96.453 width="54">width="93"> width="87">
| > 12 width="52">.219 width="91">1.461 width="89">97.914 width="54">width="93"> width="87">
| > 13 width="52">.186 width="91">1.240 width="89">99.154 width="54">width="93"> width="87">
| > 14 width="52">.092 width="91">.616 width="89">99.770 width="54">width="93"> width="87">
| > 15 width="52">.034 width="91">.230 width="89">100.000 width="54">width="93"> width="87">
| ||||||
Figure 1
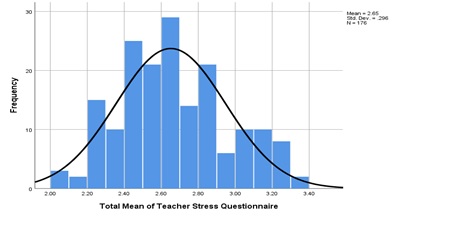
Table 5
| KMO and Bartlett's Test | > Kaiser-Meyer-Olkin Measure of Sampling Adequacy. width="31%">.738 | > Bartlett's Test of Sphericity width="35%" valign="top">Approx. Chi-Square width="31%">1187.500 | > Df width="31%">136 | > Sig. width="31%">.000 | |||
Table 6
| Communalities | > width="21%"> Initial width="24%">Extraction | > Makes an appropriate noises when he should not width="21%">1.000 width="24%">.846 | > Demands must be met immediately width="21%">1.000 width="24%">.866 | > Overly sensitive to criticism width="21%">1.000 width="24%">.543 | > Distractibility or attention span a problem width="21%">1.000 width="24%">.713 | > Mode changes quickly and drastically width="21%">1.000 width="24%">.608 | > Submissive attitude towards authority width="21%">1.000 width="24%">.667 | > Restless, always “up and on the go” width="21%">1.000 width="24%">.753 | > Excitable, impulsive width="21%">1.000 width="24%">.503 | > Excessive demand for teachers attention width="21%">1.000 width="24%">.639 | > No sense of fair play width="21%">1.000 width="24%">.640 | > Appears to lack leadership width="21%">1.000 width="24%">.654 | > Childish and immature width="21%">1.000 width="24%">.687 | > Denys mistakes or blames others width="21%">1.000 width="24%">.810 | > Does not get along well with other children width="21%">1.000 width="24%">.775 | > Uncooperative with classmates width="21%">1.000 width="24%">.733 | > Easily frustrated in all areas width="21%">1.000 width="24%">.892 | > Uncooperative with teachers width="21%">1.000 width="24%">.731 | ||
Table 7
| Total Variance Explained | > Component width="229" colspan="3">Initial Eigenvalues width="235" colspan="3">Extraction Sums of Squared Loadings | > Total width="90">% of Variance width="89">Cumulative % width="55">Total width="90">% of Variance width="90">Cumulative % | > 1 width="51">3.695 width="90">21.737 width="89">21.737 width="55">3.695 width="90">21.737 width="90">21.737 | > 2 width="51">2.398 width="90">14.105 width="89">35.842 width="55">2.398 width="90">14.105 width="90">35.842 | > 3 width="51">1.800 width="90">10.588 width="89">46.430 width="55">1.800 width="90">10.588 width="90">46.430 | > 4 width="51">1.637 width="90">9.630 width="89">56.060 width="55">1.637 width="90">9.630 width="90">56.060 | > 5 width="51">1.368 width="90">8.050 width="89">64.110 width="55">1.368 width="90">8.050 width="90">64.110 | > 6 width="51">1.162 width="90">6.835 width="89">70.945 width="55">1.162 width="90">6.835 width="90">70.945 | > 7 width="51">.904 width="90">5.316 width="89">76.261 width="55">width="90"> width="90">
| > 8 width="51">.758 width="90">4.460 width="89">80.722 width="55">width="90"> width="90">
| > 9 width="51">.670 width="90">3.939 width="89">84.660 width="55">width="90"> width="90">
| > 10 width="51">.599 width="90">3.526 width="89">88.187 width="55">width="90"> width="90">
| > 11 width="51">.415 width="90">2.444 width="89">90.630 width="55">width="90"> width="90">
| > 12 width="51">.386 width="90">2.272 width="89">92.903 width="55">width="90"> width="90">
| > 13 width="51">.339 width="90">1.993 width="89">94.896 width="55">width="90"> width="90">
| > 14 width="51">.306 width="90">1.800 width="89">96.696 width="55">width="90"> width="90">
| > 15 width="51">.231 width="90">1.361 width="89">98.057 width="55">width="90"> width="90">
| > 16 width="51">.222 width="90">1.304 width="89">99.361 width="55">width="90"> width="90">
| > 17 width="51">.109 width="90">.639 width="89">100.000 width="55">width="90"> width="90">
| ||||||
Figure 2
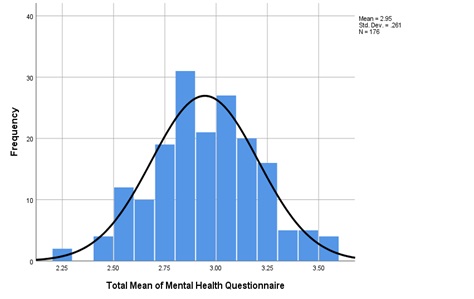
Table 8
| KMO and Bartlett's Test | > Kaiser-Meyer-Olkin Measure of Sampling Adequacy. width="18%">.715 | > Bartlett's Test of Sphericity width="39%">Approx. Chi-Square width="18%">1172.500 | > Df width="18%">136 | > Sig. width="18%">.001 | |||
Table 9
| Total Variance Explained | > Component width="227" colspan="3" valign="bottom">Initial Eigenvalues width="239" colspan="3" valign="bottom">Extraction Sums of Squared Loadings | > Total width="90" valign="bottom">% of Variance width="90" valign="bottom">Cumulative % width="54" valign="bottom">Total width="90" valign="bottom">% of Variance width="95" valign="bottom">Cumulative % | > 1 width="47">3.877 width="90">20.405 width="90">20.405 width="54">3.877 width="90">20.405 width="95">20.405 | > 2 width="47">3.075 width="90">16.184 width="90">36.589 width="54">3.075 width="90">16.184 width="95">36.589 | > 3 width="47">2.437 width="90">12.826 width="90">49.415 width="54">2.437 width="90">12.826 width="95">49.415 | > 4 width="47">2.089 width="90">10.995 width="90">60.409 width="54">2.089 width="90">10.995 width="95">60.409 | > 5 width="47">1.630 width="90">8.579 width="90">68.989 width="54">1.630 width="90">8.579 width="95">68.989 | > 6 width="47">1.244 width="90">6.547 width="90">75.536 width="54">1.244 width="90">6.547 width="95">75.536 | > 7 width="47">.920 width="90">4.840 width="90">80.376 width="54">width="90"> width="95">
| > 8 width="47">.679 width="90">3.572 width="90">83.948 width="54">width="90"> width="95">
| > 9 width="47">.609 width="90">3.204 width="90">87.152 width="54">width="90"> width="95">
| > 10 width="47">.495 width="90">2.605 width="90">89.756 width="54">width="90"> width="95">
| > 11 width="47">.479 width="90">2.520 width="90">92.276 width="54">width="90"> width="95">
| > 12 width="47">.374 width="90">1.968 width="90">94.244 width="54">width="90"> width="95">
| > 13 width="47">.281 width="90">1.477 width="90">95.721 width="54">width="90"> width="95">
| > 14 width="47">.241 width="90">1.267 width="90">96.988 width="54">width="90"> width="95">
| > 15 width="47">.222 width="90">1.168 width="90">98.156 width="54">width="90"> width="95">
| > 16 width="47">.146 width="90">.770 width="90">98.926 width="54">width="90"> width="95">
| > 17 width="47">.109 width="90">.575 width="90">99.501 width="54">width="90"> width="95">
| > 18 width="47">.091 width="90">.480 width="90">99.981 width="54">width="90"> width="95">
| > 19 width="47">.095 width="90">.190 width="90">100.000 width="54">width="90"> width="95">
| ||||||
Table 10
| Communalities | > width="10%"> Initial width="12%">Extraction | > I have been trying to work or other activities to take my mind off things width="10%">1.000 width="12%">.696 | > I have been concentrating my efforts on doing something about the situation, I am in width="10%">1.000 width="12%">.856 | > I have been using alcohol or other drugs to make myself feel better. width="10%">1.000 width="12%">.528 | > I have been getting emotional support from others. width="10%">1.000 width="12%">.753 | > I have been taking action to try to make the situation better. width="10%">1.000 width="12%">.772 | > I have been refusing to believe that it has happened. width="10%">1.000 width="12%">.934 | > I have been getting help and advice from other people. width="10%">1.000 width="12%">.873 | > I have been trying to see it in a different light, to make it seem more positive. width="10%">1.000 width="12%">.787 | > I have been trying to come up with a strategy about what to do. width="10%">1.000 width="12%">.455 | > I have been giving up the attempt to cop width="10%">1.000 width="12%">.633 | > I have been looking for something good in what is happening width="10%">1.000 width="12%">.798 | > I have been doing something to think about it less, such as going to movies, watching TV, reading, daydreaming, sleeping, or shopping. width="10%">1.000 width="12%">.934 | > I have been accepting the reality of the fact that it has happened. width="10%">1.000 width="12%">.867 | > I have been expressing my negative feelings. width="10%">1.000 width="12%">.616 | > I have been trying to find comfort in my religion or spiritual beliefs. width="10%">1.000 width="12%">.608 | > I have been trying to get advice or help from other people about what width="10%">1.000 width="12%">.794 | > I have been expressing my negative feelings. width="10%">1.000 width="12%">.699 | > I have been using alcohol or other drugs to make myself feel better. width="10%">1.000 width="12%">.910 | > I have been getting emotional support from others. width="10%">1.000 width="12%">.839 | ||
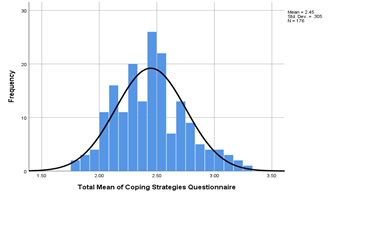
Figure 3
Testing of Hypotheses
Correlational Analysis
H1 There is a positive and significant relationship between the independent variable (occupational stress) and mediator (coping style) with dependent variable (mental health) of colleges’ physical education teachers.
Table 11
| Correlations | > width="20%"> Coping Strategies width="16%">Mental Health width="17%">Teacher Stress | > Coping Strategies width="23%" valign="top">Pearson Correlation width="20%">1 width="16%">.351** width="17%">.442** | > Sig. (2-tailed) width="20%">width="16%"> .000 width="17%">.000 | > N width="20%">176 width="16%">176 width="17%">176 | > Mental Health width="23%" valign="top">Pearson Correlation width="20%">.351** width="16%">1 width="17%">.721** | > Sig. (2-tailed) width="20%">.000 width="16%">width="17%"> .000 | > N width="20%">176 width="16%">176 width="17%">176 | > Teacher Stress width="23%" valign="top">Pearson Correlation width="20%">.442** width="16%">.721** width="17%">1 | > Sig. (2-tailed) width="20%">.000 width="16%">.000 width="17%">
| > N width="20%">176 width="16%">176 width="17%">176 | |||||
Decision
Based on the results, we can state the following:
i. Teacher stress has a statistically significant relationship with coping strategies ( r=.442**, p < 0.01)
ii. The direction between teacher stress and coping strategies is positive. It means that these variables tend to increase together i.e., higher teacher stress is associated with higher coping strategies.
iii. The strength of the relationship between teachers’ stress and coping strategy is moderate (.442** <[r] < .5).
iv. Likewise, the table indicated a statistically significant linear relationship between teachers’ stress and mental health ( r=.721**, p < 0.01)
v. The direction between teachers’ stress and mental health is positive.
vi. The strength of the relationship between teachers’ stress and mental health is strong (.7< | r | < .5).
Regression Analysis
H2The predictor (occupational stress) and mediator (coping style) have significant effects on dependent variable (mental health) of colleges’ physical education teachers.
Table 12
| Model Summary | > Model width="13%">R width="16%">R Square width="24%">Adjusted R Square width="31%">Std. Error of the Estimate | > 1 width="13%">.748a width="16%">.560 width="24%">.555 width="31%">.18068 | ||||
Table 13
| ANOVAa | > Model width="17%">Sum of Squares width="13%">df width="20%">Mean Square width="12%">F width="12%">Sig. | > 1 width="13%" valign="top">Regression width="17%">7.188 width="13%">2 width="20%">3.594 width="12%">110.092 width="12%">.000b | > Residual width="17%">5.648 width="13%">173 width="20%">.033 width="12%">width="12%">
| > Total width="17%">12.836 width="13%">175 width="20%">width="12%"> width="12%">
| |||||||
Table 14
| Coefficientsa | > Model width="28%" colspan="2">Unstandardized Coefficients width="15%">Standardized Coefficients width="10%" rowspan="2">T width="10%" rowspan="2">Sig. | > B width="14%">Std. Error width="15%">Beta | > 1 width="26%" valign="top">(Constant) width="14%">.631 width="14%">.140 width="15%">width="10%"> 4.497 width="10%">.000 | > Coping Strategies width="14%">.161 width="14%">.040 width="15%">.216 width="10%">4.003 width="10%">.000 | > Teacher Stress width="14%">.637 width="14%">.053 width="15%">.645 width="10%">11.976 width="10%">.000 | |||||||
Mediation Analysis
Results of Mediation Analysis.
Table 15
| Model Summary | > Model width="14%">R width="16%">R Square width="24%">Adjusted R Square width="30%">Std. Error of the Estimate | > 1 width="14%">.351a width="16%">.123 width="24%">.118 width="30%">.25747 | ||||
Table 16
| ANOVAa | > Model width="18%">Sum of Squares width="12%">Df width="17%">Mean Square width="12%">F width="12%">Sig. | > 1 width="17%" valign="top">Regression width="18%">1.619 width="12%">1 width="17%">1.619 width="12%">24.418 width="12%">.000b | > Residual width="18%">11.534 width="12%">174 width="17%">.066 width="12%">width="12%">
| > Total width="18%">13.153 width="12%">175 width="17%">width="12%"> width="12%">
| |||||||
Table 17
| Coefficientsa | > Model width="28%" colspan="2">Unstandardized Coefficients width="15%">Standardized Coefficients width="10%" rowspan="2">t width="10%" rowspan="2">Sig. | > B width="14%">Std. Error width="15%">Beta | > 1 width="26%" valign="top">(Constant) width="14%">1.980 width="14%">.132 width="15%">width="10%"> 14.971 width="10%">.000 | > Coping Strategies width="14%">.265 width="14%">.054 width="15%">.351 width="10%">4.941 width="10%">.000 | |||||||
Table 18
| Model Summary | > Model width="15%">R width="17%">R Square width="24%">Adjusted R Square width="28%">Std. Error of the Estimate | > 1 width="15%">.748a width="17%">.560 width="24%">.555 width="28%">.18068 | ||||
Table 19
| ANOVAa | > Model width="18%">Sum of Squares width="12%">Df width="17%">Mean Square width="12%">F width="12%">Sig. | > 1 width="16%" valign="top">Regression width="18%">7.188 width="12%">2 width="17%">3.594 width="12%">110.092 width="12%">.000b | > Residual width="18%">5.648 width="12%">173 width="17%">.033 width="12%">width="12%">
| > Total width="18%">12.836 width="12%">175 width="17%">width="12%"> width="12%">
| |||||||
Table 20
| Coefficientsa | > Model width="28%" colspan="2">Unstandardized Coefficients width="15%">Standardized Coefficients width="10%" rowspan="2">t width="10%" rowspan="2">Sig. | > B width="14%">Std. Error width="15%">Beta | > 1 width="26%" valign="top">(Constant) width="14%">.631 width="14%">.140 width="15%">width="10%"> 4.497 width="10%">.000 | > Coping Strategies width="14%">.161 width="14%">.040 width="15%">.216 width="10%">4.003 width="10%">.000 | > Teacher Stress width="14%">.637 width="14%">.053 width="15%">.645 width="10%">11.976 width="10%">.000 | |||||||
Table 21
| Model Summary | > Model width="72">R width="96">R Square width="132">Adjusted R Square width="160">Std. Error of the Estimate | > 1 width="72">.721a width="96">.519 width="132">.516 width="160">.18832 | ||||
Table 22
| ANOVAa | > Model width="114" valign="bottom">Sum of Squares width="72" valign="bottom">Df width="114" valign="bottom">Mean Square width="80" valign="bottom">F width="80" valign="bottom">Sig. | > Regression width="114" valign="top">6.665 width="72" valign="top">1 width="114" valign="top">6.665 width="80" valign="top">187.930 width="80" valign="top">.000b | > Residual width="114" valign="top">6.171 width="72" valign="top">174 width="114" valign="top">.035 width="80" valign="top">width="80" valign="top">
| > width="114" valign="top"> Total width="72" valign="top">12.836 width="114" valign="top">175 width="80" valign="top">width="80" valign="top">
| |||||
Table 23
| Coefficientsa | > Model width="164" colspan="2">Unstandardized Coefficients width="147">Standardized Coefficients width="114" colspan="2" rowspan="2">t align="center">Sig. | > B width="94">Std. Error width="147">Beta | > 1 width="74" valign="top">(Constant) width="70">.827 width="94">.137 width="147">width="60"> 6.035 width="55">.000 | > Teacher Stress width="70">.712 width="94">.052 width="147">.721 width="60">13.709 width="55">.000 | |||||||
Discussion
The current study was conducted to examine the effects of occupational stress upon mental health of colleges’ teachers. Additionally, the mediation role of coping style was taken into consideration. Moreover, group mean differences were analyzed based on some important demographic variables.
Research in the relevant area has been found that teaching community reported an enormous occupational stress and poor mental health in comparison with other professions (Ahola et al., 2014; Bauer et al., 2014; Havermans et al., 2016). In the current study, occupational stress and mental health of the college teachers in Southern Punjab, Pakistan were examined. The analyzed data indicated a clear correlation among occupational stress, mental and coping style. Likewise, regression analysis has confirmed that occupational stress and coping strategy statistically predicted mental health of the colleges’ teachers. One of the most important factors that might predict academic staff stress at college level in Pakistan is increasingly higher expectation at work. This issue may be made worse by the enhanced use of elevated test results at the state and district levels. Such testing restricts the amount of control that teachers have over the content and pace of their own work, and it also raises the possibility that colleges and teachers will be shut down as a result (Lee et al., 2011).
The mediation analysis reported that that
Mediating variable completely mediated the relationship between occupational stress and mental health. Past research revealed that coping strategy used when ones’ member of any organization feels difficult to manage occupational stress (Ryu, Yang, & Choi, 2020). It seems that teaching community as college level to apply coping strategy, because they might have some occupational stress to manage their classes and other disciplinary actions at their respective colleges. These findings are in consistent with other research among other community (Acquadro-Maran, Zedda, &Varetto, 2018). A study reported that A teacher's work experience is significantly impacted by the degree to which they are able to exert control over the working conditions they are subjected to. Therefore, the amount of support they get from coworkers, and the strategies they use to adjust to obstacles that arise in the workplace are considered important coping strategies (Blix et al., 2006).
Conclusion
The study reported an initial understanding of the association among occupational stress and mental health among lecturers working at college level. Results further identified a significant mediating role of copying style in the relationship between occupational stress and mental health. The ability to think how to solve problems, assist other colleagues in addition trying to find comfort in religion or spiritual beliefs were reported mediating factors between occupational stress and mental health.
The current study has several limitations that need to be highlighted. The first limitation of the current study is that the researcher used cross-sectional data from southern region of Punjab, Pakistan. Longitudinal studies are strongly recommended; however, longitudinal studies need larger financial budget and time too that were not available for the present research work. The second limitation deals with college level professional as occupational stress may vary among professions, therefore; the findings of the current study may not be generalized to other professions such as schools and universities.
Recommendations
To enhance mental health of the teaching community in general and lecturer in a particular, those interventional programs may be established within institutional organizations both at regional and national levels that help them assisting to reduce distress and to promote copying skills to deal with their critical incidents on their work. Hence, future research may deal with how to develop such interventional program and also to evaluate the effectiveness these programs to promote and develop mental health and work performance of teaching community.
One-day workshop and seminars on managing work-related stress must be conducted on a regular basis to train them how to deal with occupational stress. Physical recreational activities must be encouraged in the workplace as these activities proved very helpful in improving mental health and reduce stress.
References
- AcquadroMaran, D., Zedda, M., &Varetto, A. (2018). Organizational and occupational stressors, their consequences and coping strategies: A questionnaire survey among Italian patrol police officers. International journal of environmental research and public health, 15(1), 166.
- Agbonluae, O. O., Omi-Ujuanbi, G. O., & Akpede, M. (2017).Coping strategies for managing occupational stress for improved worker productivity. IFE PsychologIA: An International Journal, 25(2), 300-309.
- Ahola, K., Hakanen, J., Perhoniemi, R., & Mutanen, P. (2014). Relationship between burnout and depressive symptoms: A study using the person-centred approach. Burnout Research, 1(1), 29-37.
- Almatrooshi, B., Singh, S. K., & Farouk, S. (2016). Determinants of organizational performance: a proposed framework. International Journal of productivity and performance management, 65(6), 844-859.
- Andreeva, E., Brenner, M. H., Theorell, T., & Goldberg, M. (2017). Risk of psychological ill health and methods of organisational downsizing: a cross-sectional survey in four European countries. BMC public health, 17(1), 1-12.
- Barnay, T. (2016). Health, work and working conditions: a review of the European economic literature. The European Journal of Health Economics, 17(6), 693-709.
- Bauer, G. F., Hämmig, O., Cartwright, S., & Cooper, C. L. (2014). Towards organizational health: Stress, positive organizational behavior, and employee well-being. Bridging occupational,organizational and public health: A transdisciplinary approach, 29-42.
- Blix, A. G., Cruise, R. J., Mitchell, B. M., & Blix, G. G. (2006). Occupational stress among university teachers. 36(2), 157–169.
- Havermans, B. M., Schelvis, R. M., Boot, C. R., Brouwers, E. P., Anema, J. R., & Van Der Beek, A. J. (2016). Process variables in organizational stress management intervention evaluation research: a systematic review. Scandinavian Journal of Work, Environment & Health, 371-381.
- Kang, L., Ma, S., Chen, M., Yang, J., Wang, Y., Li, R., & Liu, Z. (2020). Impact on mental health and perceptions of psychological care among medical and nursing staff in Wuhan during the 2019 novel coronavirus disease outbreak: A cross-sectional study. Brain, behavior, and immunity, 87, 11-17.
- Lee, J. C. K., Zhang, Z., & Yin, H. (2011). A multilevel analysis of the impact of a professional learning community, faculty trust in colleagues and collective efficacy on teacher commitment to students. Teaching and teacher education, 27(5), 820-830.
- Ryu, G. W., Yang, Y. S., & Choi, M. (2020). Mediating role of coping style on the relationship between job stress and subjective well-being among Korean police officers. BMC public health, 20(1), 1-8.
- Van Droogenbroeck, F., & Spruyt, B. (2015). Do teachers have worse mental health? Review of the existing comparative research and results from the Belgian Health Interview Survey. Teaching and Teacher Education, 51, 88-100.
Cite this article
-
APA : Yaqoob, I., Aslam, M., & Rani, A. (2023). Effects of Occupational Stress on Mental Health in Colleges' Physical Education Teachers: Mediating Role of Coping Style: A Case Study of Southern Districts of Punjab. Global Educational Studies Review, VIII(I), 128–141. https://doi.org/10.31703/gesr.2023(VIII-I).12
-
CHICAGO : Yaqoob, Iqra, Muhammad Aslam, and Asma Rani. 2023. "Effects of Occupational Stress on Mental Health in Colleges' Physical Education Teachers: Mediating Role of Coping Style: A Case Study of Southern Districts of Punjab." Global Educational Studies Review, VIII (I): 128–141 doi: 10.31703/gesr.2023(VIII-I).12
-
HARVARD : YAQOOB, I., ASLAM, M. & RANI, A. 2023. Effects of Occupational Stress on Mental Health in Colleges' Physical Education Teachers: Mediating Role of Coping Style: A Case Study of Southern Districts of Punjab. Global Educational Studies Review, VIII, 128–141.
-
MHRA : Yaqoob, Iqra, Muhammad Aslam, and Asma Rani. 2023. "Effects of Occupational Stress on Mental Health in Colleges' Physical Education Teachers: Mediating Role of Coping Style: A Case Study of Southern Districts of Punjab." Global Educational Studies Review, VIII: 128–141
-
MLA : Yaqoob, Iqra, Muhammad Aslam, and Asma Rani. "Effects of Occupational Stress on Mental Health in Colleges' Physical Education Teachers: Mediating Role of Coping Style: A Case Study of Southern Districts of Punjab." Global Educational Studies Review, VIII.I (2023): 128–141 Print.
-
OXFORD : Yaqoob, Iqra, Aslam, Muhammad, and Rani, Asma (2023), "Effects of Occupational Stress on Mental Health in Colleges' Physical Education Teachers: Mediating Role of Coping Style: A Case Study of Southern Districts of Punjab", Global Educational Studies Review, VIII (I), 128–141
-
TURABIAN : Yaqoob, Iqra, Muhammad Aslam, and Asma Rani. "Effects of Occupational Stress on Mental Health in Colleges' Physical Education Teachers: Mediating Role of Coping Style: A Case Study of Southern Districts of Punjab." Global Educational Studies Review VIII, no. I (2023): 128–141. https://doi.org/10.31703/gesr.2023(VIII-I).12